UK Startups Aren't Vanishing

Words Lily Ruaah

UK Startups Aren't Vanishing

What the data shows: UK incorporations fell 5.7% year-on-year in H1 2026, to 402k. That’s the second consecutive half-year decline and the lowest H1 total in five years.

What that number leaves out: the UK’s active company base climbed to a record 5.66m over the same period, application software incorporations rose 40%, and more established, consumer-facing categories like clothing and hospitality pulled back sharply. Wales’s regional figures tell the same kind of story: they look very different depending on whether you compare H1 2026 with the previous half or with the longer-term H1 norm. 

“A fall in incorporations is not the same thing as a fall in entrepreneurship. The interesting story isn’t just how many companies are being created, but what kinds of companies they are and whether or not they survive and scale.”

Henry Whorwood, Managing Director of BeauhurstInsights

In our new series, we’re busting the myths that come from UK, German and Irish business data. The headlines say one thing, but when you dig into the data, does it hold true? This week: does a falling incorporation number mean UK entrepreneurship is weakening, or is the more interesting story about what kind of company gets started, not how many?

Where this number comes from

There were 402k new companies incorporated in the UK in H1 2026, down 5.7% on H1 2025 and the second consecutive half-year decline. It’s the lowest H1 total in five years.

Two regulatory changes impacted this window. Mandatory identity verification for directors and persons with significant control arrived in November 2025 under the Economic Crime and Corporate Transparency Act. And Companies House then doubled its incorporation fees from February 2026. Of the two, identity verification is likely to have contributed more significantly to the slowdown.

Read in isolation, a 5.7% fall in new companies looks like a straightforward story: fewer people are starting businesses. That reading misses two things.

One: a smaller flow doesn’t mean a smaller base

Identity verification exists specifically to raise the bar for incorporation, filtering out low-intent and fraudulent registrations in favour of companies with genuine longevity. A shrinking count of new filings, in other words, can mean a higher-quality register rather than a weaker pipeline of founders.

And the active company base, the actual stock of running businesses, as opposed to the flow of new filings, grew to a record 5.66m over the same period. Two numbers, same report, pointing in opposite directions: the flow of new incorporations is down, the stock of active companies is up. Most coverage of this release will lead with the flow number alone. That’s accurate on its own terms, but it leaves out half the picture.

Two: the companies still forming look different

Sector data from the same release makes the point even sharper. Application software rose 40% year-on-year to 28.1k incorporations in H1 2026, overtaking restaurants and property development to become the UK’s most common industry for new companies. The wider Digital and technologies category grew 38% to 28.9k. 

Over the same period, more established, consumer-facing sectors moved the other way: clothing incorporations fell 26% year-on-year, and restaurants, pubs, cafés and takeaways fell 10%, likely reflecting cost pressures from rising business rates and employer National Insurance contributions bearing down harder on premises-based businesses than on digitally native ones.

Put those together and the overall 5.7% fall isn’t a uniform retreat. It’s software and tech pulling one way, hard, and traditional consumer-facing sectors pulling the other, with the net effect landing as a comparatively modest-looking decline. That’s a shift in the shape of UK company formation, not just its volume.

Worth holding onto some caution here too: it’s too early to say whether this is a temporary adjustment or a lasting shift, and part of the fall in raw incorporation numbers may reflect founders, including solopreneurs, choosing not to incorporate at all rather than genuinely fewer businesses being started.

Even so, a falling incorporation count doesn’t necessarily mean the UK is producing fewer entrepreneurs. It may instead point to a changing mix of companies being formed, with software and technology accounting for a growing share of startup activity. 

Discover England’s fastest-growing companiesRead the blog

So does a 5.7% fall mean UK entrepreneurship is weakening?

This is really the question the whole report is circling. Incorporations fell 5.7%, the lowest H1 total in five years. But a 5.7% fall in a filing count doesn’t automatically translate into a 5.7% fall in entrepreneurial activity, not when the active company base is at a record high, and not when the mix of what’s being formed is visibly shifting towards higher-growth sectors like software. 

The honest answer is that the picture is more nuanced than the headline number allows: some of the fall reflects a genuinely more selective environment; some of it reflects that founders are showing up differently rather than not showing up at all.

A regional case study: what happened in Wales depends on which chart you read

Regional figures are the clearest illustration of how much a conclusion depends on the benchmark you pick. The underlying report includes two different regional comparisons for H1 2026, and for Wales they tell almost opposite stories.

Against the 2022–25 H1 median, every UK nation and region posted fewer incorporations than usual, but Wales’s shortfall was mid-table: South West down 11.8%, West Midlands down 10.5%, East Midlands down 9.9%, Northern Ireland down 7.9%, South East down 7.4%, North East down 6%, Wales down 5.4%, Yorkshire and the Humber down 5.3%, East of England down 4.6%, North West down 4.4%, Scotland down 1.9%, London down 1.1%. On this measure, Wales’s fall is smaller than five other UK nations and regions.

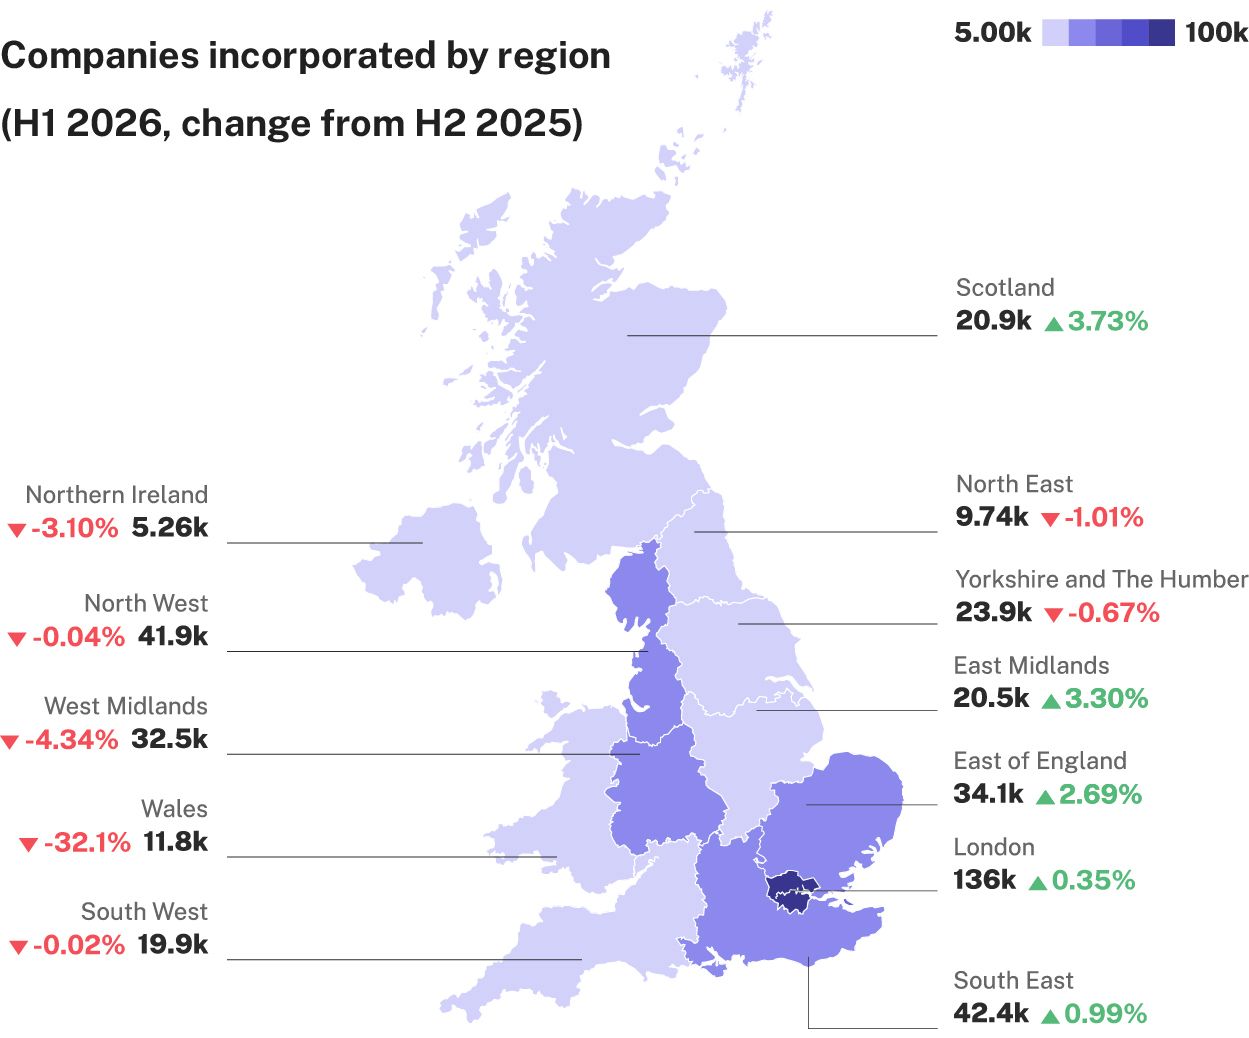
Companies incorporated by region

Then there’s the report’s other comparison: H1 2026 against the immediately preceding half, H2 2025. Here Wales stands well outside every other region, down 32.1% to 11.8k, against swings elsewhere of a few percentage points either way (Scotland up 3.73%, East Midlands up 3.30%, West Midlands down 4.34%, Northern Ireland down 3.10%).

Same region, same six-month period, two benchmarks in the same report, answering two different questions: measured against the previous half, Wales shows a sharp recent fall; measured against its longer-term H1 norm, it sits much closer to normal. Both are valid. They’re just not measuring the same thing.

Part of the gap is likely a data quirk rather than a market signal. Companies House assigns companies with missing or invalid addresses to a default Cardiff address, and that reassignment happens after incorporation, with a lag. Older cohorts, like H2 2025, have had more time to accumulate reassignments than the newest one, H1 2026, which is a plausible reason the two benchmarks diverge so sharply for Wales specifically. The report itself is cautious here too, noting the 32.1% figure may be overstated without putting a number on how much.

The fastest-growing companies in WalesRead the blog

Why this matters if you’re using regional or sector data

If you’re an investor or ecosystem-builder, don’t take a single region’s period-on-period change at face value, especially soon after a change in how addresses or entities get recorded, and especially when only one comparison window is on offer. Where possible, check a swing against a longer-run benchmark as well as the most recent period, and check whether it lines up with a known data or policy event before treating it as a market signal.

Policymakers and regional bodies have a more direct stake here. A region can look like it’s underperforming purely because an unrelated national administrative process is routing unresolved filings through its jurisdiction, or because the comparison window happens to catch that process mid-lag. That’s worth raising if Wales, or any comparable region, gets cited in funding or policy conversations off the back of this data.

And if you’re writing about the report yourself, the accurate version of the Wales line isn’t “startup activity in Wales collapsed 32%.” It’s closer to: measured against the previous half, reported incorporations in Wales fell 32%, but measured against the longer-run norm the fall is closer to 5%, in line with several other UK regions, and a meaningful share of the gap between those two figures reflects address reassignments still working through the system. Less punchy, but more accurate.

The myth, busted

A 5.7% fall in incorporations is not the same thing as a 5.7% fall in entrepreneurship. The flow of new companies is down, but the stock of active companies is at a record high, application software incorporations rose 40% even as the total fell, and the sectors driving new formation are visibly shifting towards software and tech while more traditional consumer-facing sectors pull back. The headline number is real. It just isn’t the whole picture.

Wales makes the same point at regional scale, in an unusually clean way: the same report gives two very different readings of Wales’s H1 2026 figures: down 32.1% against the previous half, but down just 5.4% against its longer-term H1 norm. Neither is ‘the’ true decline, they’re answers to different questions. Next time a headline figure moves sharply, whether it’s a national flow number or a single region’s, the useful first question probably isn’t whether it went up or down. It’s what it’s being compared against, and whether anything changed about how it gets counted.

See past the headline yourself

Seeing the real picture here means knowing the mechanics behind a number, not just reading the number itself: the shift towards software and tech in what’s being incorporated, the regulatory changes affecting incorporation, the reassignment pattern behind Wales’s figures, the reassignment pattern behind Wales’s figures. All of it comes from company-level records tied to Companies House filings, not modelled estimates.

That’s the level Beauhurst data operates at. If you’re benchmarking a region, sizing up an ecosystem, or just trying to write about UK business formation without repeating a filing artefact as fact, that’s the difference between quoting a headline and understanding what’s actually behind it.

Explore Beauhurst Insights to dig into the full New Startup Index H1 2026 dataset, or book a demo to see what it looks like with your own regional or sector benchmarks.

Where does this data come from?
We recently published the New Startup Index H1 2026 in collaboration with NatWest, examining business and venture creation across the UK in H1 2026.

Read the full report


Discover our data

Get access to unrivalled data on all the companies you need to know about, so you can approach the right leads, at the right time.

Book a demo today to see all of the key features of the Beauhurst platform, as well as the depth and breadth of data available.

An associate will work with you to build a sophisticated search, returning a dynamic list of organisations that match your ideal customer profile.