
The UK General Election in Data
Analysing regional equity investment from 2019 to 2024
It’s official — the Labour Party has formed a new government following a landslide majority.
And as the UK enters a new era of political leadership, business leaders are clamouring to see what growth-friendly policies the new government cooks up. The first morsel on the menu, to continue the (admittedly tenuous) culinary theme, is a brand-new £7b national wealth fund.
Today, we’re looking back at regional investment prior to the 2019 and 2024 elections, analysing equity fundraising to find out what has changed between now and then.
We’ve also tracked regional shifts in voting patterns across both elections, assigning a region a majority party, based on the greatest number of constituencies won by that party in the election.
So, sit back with a brew, and let’s examine the changing UK political landscape against the backdrop of the wider highs and lows of the equity fundraising market.
The Local Growth Index
We analysed every UK local authority, from employment data to financials and even patent data. Download a digital copy here, or request a free hardback.
The state of equity
2019 vs 2024
Remember the comparative halcyon days of 2019? There was no global pandemic, war had not yet broken out in Ukraine, and the Freddo bar was — for a brief period — once again reduced to 10p.
Freddo indexes aside, it was a very different time to the present. Wider investment conditions were more favourable, with the caveat that the markets still had to deal with the uncertainty around Brexit policy prior to the election.
Regardless, our fundraising data shows that UK companies still benefited from a handsome £78.7b in equity investment alone in the 12 months leading up to the 2019 general election.
As one might expect, London took the lion’s share of this investment with 62% of the total, with the East of England and South East taking 8.6% and 7.9% respectively.
Here’s a full breakdown of regional investment in between 11th December 2018-2019:

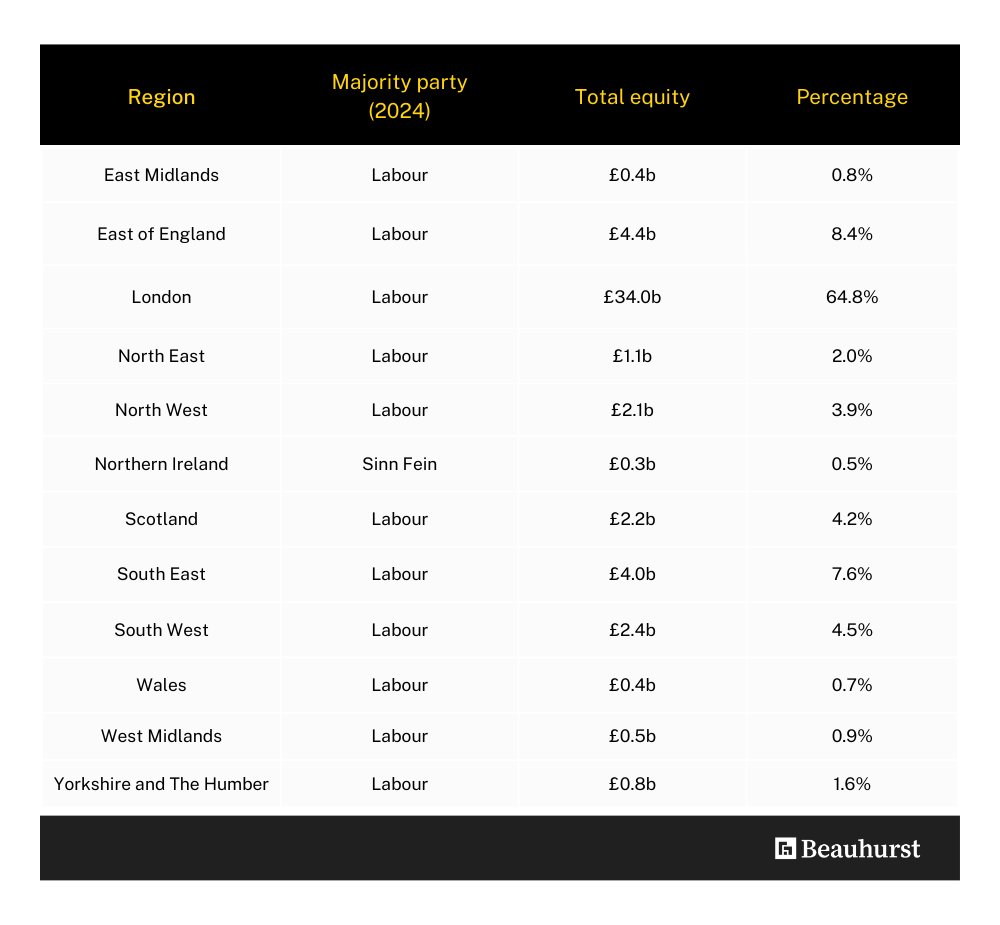
Fast-forward to the present, and every region has turned red with the exception of Northern Ireland who shifted from the DUP to a Sinn Fein majority, when measuring the number of constituencies won.
The big key difference, amidst this sea of red, is that equity investment between the 12 months from 4th July 2023-2024 is down by 26.6% when compared against the 12 months preceding the 2019 election. Whereas the total investment in December 2018 – December 2019 equated to £78.7b, in July 2023 – July 2024 we’ve seen just £52.3b.
London’s overall investment has fallen broadly in line with the wider national decrease, dropping from £44.3b to £34.0b. However, due to companies in the North West, Scotland, and the West Midlands seeing a greater proportion of drops in equity investment, London has increased its overall proportion from 62.0% to 64.8%.
Contrast this with the North West dropping almost £3b of private investment, down from £5b in 2019, and we can see substantial transfer of power in regional investment.
There is a wider context here. First there’s an ongoing cost of living crisis. Then there’s a global market slowdown, caused partly by the recovery from COVID-19 and partly the ongoing war in Ukraine.
And with less money in the pockets of both households and businesses, higher interest rates and inflation figures invariably impact investment too.
But there are positive signs that investment (and the wider economy) is recovering. Only a week ago, EY revealed that the UK’s foreign direct investment (FDI) grew amidst a wider European slump. Meanwhile, the British Business Bank announced that the UK had overtaken India to become the third largest venture capital market in the world.
Key takeaways
Politics is complicated, and the majority of the electorate remains a world away from inner circles of private equity investment.
In this respect, this article is not an analysis of the causes behind voting intentions. It is, however, an interesting snapshot of wider market conditions in the context of the two previous general elections.
What is clear is that overall investment is down again, as it has been since the dizzying heights of 2021 where no fewer than 25 unicorns were minted in the UK. We’ve analysed this drop in investment in detail, which you can read in our latest edition of The Deal. What’s more, with less investment to go around, money is becoming increasingly concentrated in seats of economic power.
So, what’s next? With a new government in power, we’ll be debriefing Labour’s economic manifesto commitments over the coming weeks, and what their proposed policies might mean for the broader UK investment market. Watch this space.
Here's the deal...
Explore our annual equity market update for access to every equity deal made in the UK throughout 2023.
How to find this data yourself
Want to perform your own analysis of the data? Well, if you’re a subscriber, you can right now. Here’s a brief video on how to use the platform to find such data.
And if you’re more the reading type, here’s a step-by-step guide to how we collated this data, using the Beauhurst platform. We’ve also added some direct links below so you can automatically populate your search too.
Step One
Searching for fundraisings
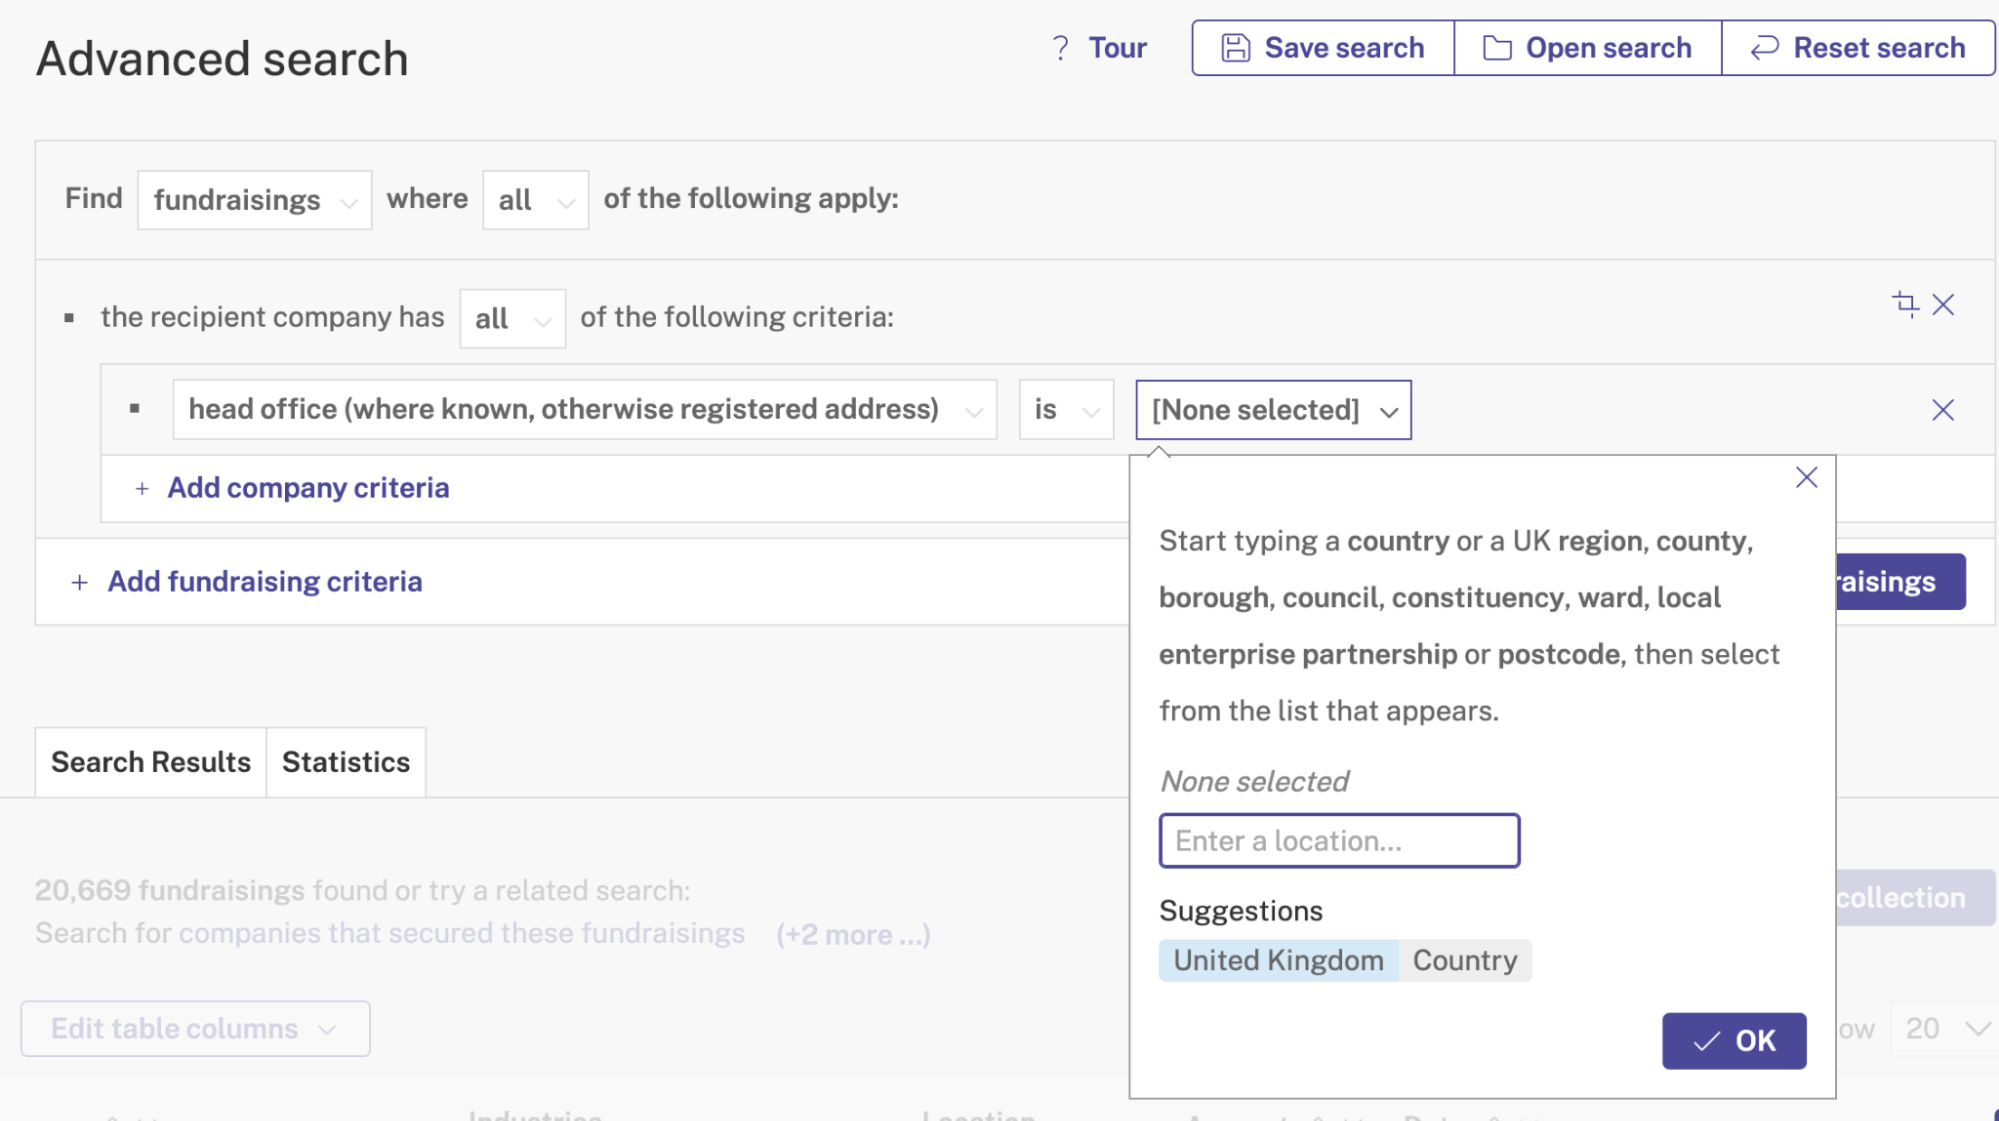
First off, navigate to Advanced search on the platform. Here, you’ll want to search for fundraisings, rather than companies.
As things are, this will give you every fundraising ever on the platform. So, we’ll want to refine this search further.

Step Two
Selecting your location
Next, use location as a new criterion by selecting Company that secured the fundraising > Location.
In theory, you could make your search as wide as the United Kingdom, or as narrow as your local area. This will depend on the depth of analysis required.
In the event that you’re analysing multiple regions, you can simply run a separate search for each region and then save each search result as a Collection. This enables straightforward analysis on the platform.
Step Three
Selecting the form of fundraising — and a date range
Finally, you may wish to select a form of fundraising in order to distinguish between loan and equity fundraising. This can be done by selecting Form of funding and selecting either equity or loan.
For this article, we chose to analyse equity so we simply checked that box.
And finally, to fine tune your search, add a date range by selecting Date of fundraising. This allows you to stipulate a specific window of fundraising, enabling historic analysis.

If you’re already subscribed to Beauhurst, here’s a couple of datasets we made earlier. Click one of the buttons below for the full methodology. And if you have any additional questions, please get in touch with your account manager.
Not yet a subscriber?
Fancy a sneak peek at how Beauhurst could benefit your organisation? Book a demo with one of our experts, or check our latest series of articles on how subscribers get the most out of the data.

Ready to upgrade your approach?
Discover how BeauhurstImpact can help you make a real difference.