
Simplify Impact Reporting with Beauhurst GVA Data
Discover the direct impact of local government interventions with rich, granular GVA data.
GVA (Gross Value Added) is a vital metric for demonstrating a company’s contribution to the UK economy, at both national and regional levels. Local councils in particular use GVA as a quantitative measure to justify investment and support policy-making initiatives.
The ONS (Office for National Statistics) dataset — a key source for many — is only published once a quarter and the deepest analysis available for GVA is by region. And whilst this is useful for a macro look at the national economy, it can lack granularity for many.
So, in 2024, we launched GVA data on the Beauhurst platform, enabling decision-makers to discover GVA down to individual company level.
Why our GVA data is making a difference
For our local government clients, our GVA dataset is already changing the game. It enables teams to track the effectiveness of interventions on a company or region’s success.
And when paired with our industry classification system — covering over 225 industries — you can reveal which industries in your area are the greatest contributors to the local economy.
Universities can also use Beauhurst to track the GVA of spinouts, and use this data to support knowledge exchange and commercial activities.
How we calculate GVA
At Beauhurst, we calculate GVA using the GVA(i) formula, also known as the ‘income approach’. This means adding employee wages + operating profit (EBIT) + depreciation + amortisation together to deliver a final figure.
By comparison, the ONS adds the sum of all income from employment (compensation of employees), and other income generated by the production of goods and services and uses this data to deliver very good regional analyses.
The key difference here is that the Beauhurst method of calculating EBITDA data by company gives a much clearer picture of a company’s direct value to the local economy. And, as a result, we’re able to algorithmically calculate GVA when a company files its financials.

Trusted by local councils
“Beauhurst is the go-to tool if you want to understand your local economy and its path trajectory, to understand who your key strategic firms are, and to develop relationships with them.”
Where to find GVA data on Beauhurst
You can view GVA data on the Beauhurst platform in a number of different ways. The most popular uses we’ve found for clients include looking up the GVA of specific companies, or by casting the net wider to view the GVA of a collection of companies.
The process differs slightly for each method, so we’ve created a short guide on how to use the platform to find GVA.
Find GVA by company
Finding GVA by company is straightforward.
On a company’s profile, just navigate to the financials tab. Under the ‘Miscellaneous’ table, you’ll find the company’s GVA for each financial year.
Looking by company is a great way to get an on-the-spot answer to one particular company’s GVA. However, if you’re looking to report on aggregate performance, this is where grouping multiple companies comes in.
GVA x Collections: The ultimate power tool
The Beauhurst Collection function lets you create a group of companies, based off a highly-adaptable set of criteria.
This saved grouping is then accessible to you any time you want to look at it. Collections are widely used by our clients to help them monitor the performance of companies, look for opportunities in the market or manage portfolios.
But it’s also a powerful tool to monitor impact, for both commercial and policymaking purposes. For example, if you need to assess the effectiveness of a government grant scheme on companies in your local area, simply build a collection of the companies that were approved for the scheme.
Likewise, if you’re working in a university knowledge exchange department looking to assess the impact of spinouts on the local economy, simply search for spinouts from your institution and add them all to a collection. This allows you to measure GVA both historically and between custom timescales.
If you have a set of specific companies in mind, you can simply use the search bar to visit a company profile. Then, click the collections button at the top of the page to add it to one of your Beauhurst Collections.
Here’s a short video on how to do it, as well as an example of what a company collection will look like once you’ve built it.
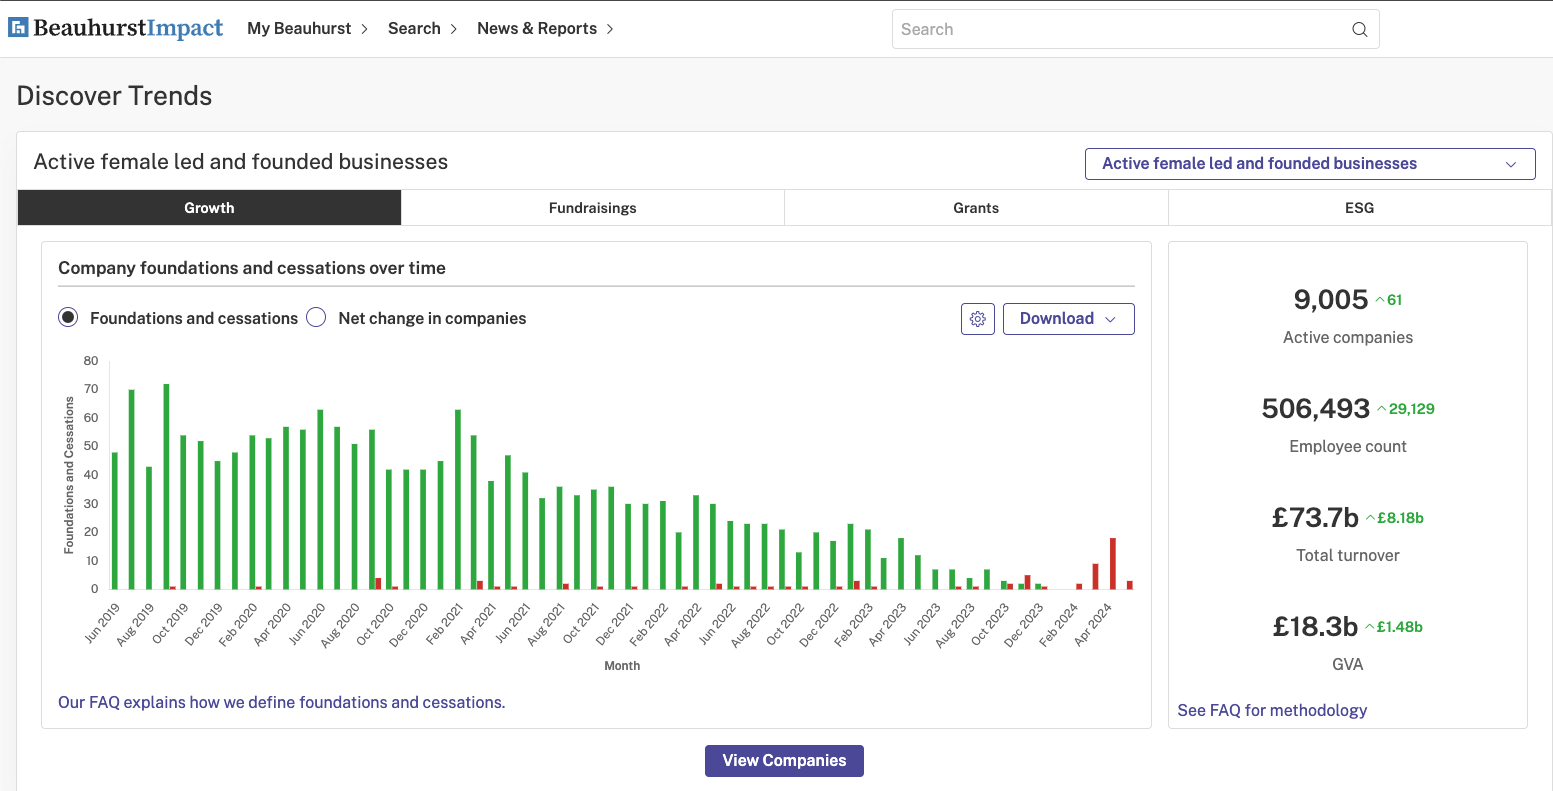
Once you’ve created a collection, you can view the aggregate GVA of the collection on your BeauhurstImpact homepage. This will give you the total gross value added for every company in your cohort, along with how much it has grown.
GVA data for your local area
Simplify impact reporting by exploring and exporting key financial data for companies and sectors in your local area. Book a tour of the platform to find out how.
This is just a whistle-stop tour of the Beauhurst platform — check out the blog for all the latest features, ‘how to’ guides, and industry trends.
In the meantime, if you’ve not used the platform before, why not book a demo? Simply fill in the form below and one of our platform experts will walk you through some of the key features that local councils and universities use.
FAQs
We’re happy to show you around the Beauhurst platform — just book a meeting with one of our experts who will talk to you about subscription options.
At Beauhurst, we calculate GVA using ‘income approach’ model. This means adding employee wages + operating profit (EBIT) + depreciation + amortisation together to deliver a final figure.
Using EBITDA data in conjunction with machine learning allows us to give you precise, timely GVA data at all times.
Nope! As a Beauhurst subscriber, you automatically get access to this data.
If you have any questions or want to talk to us more about it, contact your Account Manager or Client Experience Manager.
See the platform for yourself
Want to simplify your impact reporting? Fill in the form below to book a meeting directly with one of our team members.