How to Predict Industry Trends Using Company Data

Words Lily Ruaah

How to Predict Industry Trends Using Company Data

Aggregate industry statistics tell you what happened. Company-level data tells you what’s happening now.

By the time a sector shift shows up in official business statistics, an annual industry survey, or a trade body’s year-end report, the companies driving it have usually been incorporating, raising, hiring, acquiring, and pivoting for a year or more. The signal was there. It just wasn’t being read.

The strategy teams, investors, and analysts who make the sharpest sector calls tend to read company data as a leading indicator. They watch where new businesses are forming, where capital is flowing, which groups are rolling up competitors, and which companies are quietly rewriting how they describe themselves. Then they build those signals into an argument they can defend, company by company.

This guide covers four things:

  • Why bottom-up company data predicts industry trends earlier than top-down sources
  • Which signals matter most
  • An eight-step framework for turning signals into a call
  • The pitfalls that trip up even experienced analysts

Why company data predicts industry trends earlier than aggregate data

Top-down sources are accurate, but they’re slow, coarse, and selective in ways that make them poor early-warning systems. Bottom-up company data fixes all three problems at once.

The lag problem

Official business statistics, such as the Office for National Statistics (ONS) Business Population Estimates, are published once a year, months after the point in time they describe. Sector body reports and industry surveys tend to follow the same annual rhythm, and often rely on data that was already old when it was collected.

That’s fine for describing the shape of an industry. It’s not much use for spotting the turn. A sector can go from overheated to oversupplied inside a single reporting cycle. By the time the annual report confirms it, the strategic window has closed.

Company data moves daily. A new incorporation, a funding round, an acquisition, or a director appointment: each one is a dated event, recorded within days. Even filed accounts showing headcount up 40%, which describe a period that has already ended, arrive long before the sector statistics catch up.

The classification problem

Most official industry statistics are organised by Standard Industrial Classification (SIC) codes. The current UK system was last revised in April 2026, but it still has a long way to go in terms of accurately describing what a company does, especially as many companies now straddle two or even several industries.

The result is that many of the sub-sectors strategists care most about simply don’t exist in the statistics. Agritech, insurtech, cleantech, quantum, and generative AI are scattered across broad umbrella codes like ‘other software publishing’ or ‘other research and experimental development on natural sciences and engineering’. You can’t track the growth of a sector that the data can’t see.

How to Find Companies when SIC Codes are Too BroadRead the blog

The sample problem

The other common inputs to trend analysis (client conversations, media coverage, conference chatter, and survey panels) share a bias. They capture the visible slice of a sector: the companies with PR teams, the founders on stage, the businesses big enough to be surveyed.

That slice is rarely representative. The hundred quiet incorporations in a new niche, or the steady trickle of dissolutions in an old one, don’t make headlines. But they’re often where the trend starts.

The comprehensiveness advantage

Bottom-up analysis inverts the approach. Instead of starting with a sample or a published total, you start with every company and every event, and aggregate upwards.

That gives you three things top-down sources can’t:

  • Timeliness, because events are captured as they happen.
  • Granularity, because you can define sectors however the question demands.
  • Evidence, because every number traces back to named companies.

Sophisticated readers dismiss trend claims they can’t check. Company-level data makes your claims checkable.

The signal types that predict industry trends

Not every data point is a signal. These 10 company-level indicators are the ones that most reliably move ahead of a sector shift. The trick is knowing what each one tells you, and what it doesn’t.

Company formation rates by sector

Rising incorporations in a niche are often the first sign that founders see an opportunity. Falling formation rates in an established sector can signal saturation or rising barriers to entry. Track them by sub-sector and region, not just in total. Our New Startup Index with NatWest does exactly this for business creation across the UK.

Dissolution rates and dormancy patterns

Dissolutions, liquidations, and companies going dormant are the mirror image of formations. A rising dissolution rate among young companies points to distress or a shake-out. A falling rate alongside fewer new entrants often precedes consolidation.

Dormancy is especially telling. Companies that stop filing active accounts tend to show up in the data long before they formally close.

Fundraising volume and stage distribution

Typically where capital goes, activity follows. But the shape of investment matters as much as the total.

A sector dominated by seed rounds is still being explored. One where seed activity is falling while later-stage rounds grow is maturing and concentrating. A drop in follow-on rounds, or a rise in down rounds, is an early warning that investors are losing conviction.

Merger and acquisition activity

A cluster of acquisitions in a fragmented sector is the classic sign of consolidation. Watch for repeat acquirers and private-equity-backed buy-and-build platforms: when the same few buyers keep appearing, a roll-up is under way. Our Exits in the UK report tracks acquisitions and IPOs across the market.

Headcount growth patterns

Hiring is one of the most honest signals a company gives. Funding announcements can be spun; payroll can’t.

Accelerating headcount growth across a sector, especially at companies past the startup stage, shows that demand is real. Sector-wide hiring freezes or falling headcounts can be an early sign of slowing demand. Headcount in filed accounts arrives with a lag, though, so read it alongside more timely signals.

Sector migration

When established businesses start describing themselves differently, change their stated activity, or launch new divisions, the industry boundary is shifting.

A wave of logistics companies moving into robotics, or financial services firms reclassifying as fintech, can signal convergence before any new sector is formally recognised.

Buzzword adoption

The language companies use to describe themselves changes before their revenue mix does. Tracking how many companies use emerging themes in their descriptions, or are tagged with them (generative AI, carbon capture, defence tech, or quantum, for example), shows how quickly a concept is spreading from early movers to the mainstream.

It also helps separate real adoption from marketing noise, if you check the language against funding and hiring.

Geographic clustering

New sub-sectors rarely emerge evenly. They concentrate around universities, research institutions, anchor employers, and specialist investors.

Mapping where formations and fundraisings are clustering shows where a sector is taking root, and which places are falling behind. 

Ownership shifts

Changes in who owns a sector’s companies often predict how it will behave:

  • A rising share of private equity ownership points to consolidation and margin focus.
  • Growing foreign ownership can signal that international groups see strategic value.
  • Listings and delistings show whether public markets are buying the story.

Founder and executive movement

Talent moves before capital does. When experienced executives leave incumbents to found or join startups in a niche, they’re voting with their careers.

Conversely, a stream of senior departures from a sector’s leading companies can be a quiet signal that insiders see trouble ahead.

A framework for predicting industry trends using company data

Signals on their own are just data. Turning them into a defensible call takes a repeatable process. This eight-step framework works whether you’re writing a sector briefing for a client, building an investment thesis, or preparing a market map.

Step 1: Define the sector scope beyond SIC codes

Start with a precise definition of what’s in and what’s out. If you lean on SIC codes alone, you’ll either miss most of a modern sub-sector or drown it in irrelevant companies.

Instead, combine a modern industry classification with emerging-theme tags and keyword searches of company descriptions. Then sense-check the list: pull a sample of companies at random and ask whether each belongs. Our guide on finding companies when SIC codes are too broad walks through this in practice.

Step 2: Establish a baseline

Before you can spot a change, you need to know where the sector stands today. Record the essentials:

  • Number of active companies
  • Age profile
  • Total employment and turnover
  • Funding raised
  • Ownership mix
  • Geographic distribution

The baseline is also your sense check. If your sector definition produces a total that’s wildly out of line with what industry insiders would expect, revisit Step 1 before going further.

Step 3: Identify the leading signals

Decide which signals are most relevant to the trend you’re testing:

  • An emergence thesis leans on formations, early-stage funding, and buzzword adoption.
  • A consolidation thesis leans on acquisitions, repeat acquirers, falling formation rates, and capital concentrating in fewer, larger rounds.
  • A decline thesis leans on dissolutions, dormancy, down rounds, and shrinking headcounts.

Write your hypothesis down at this point, along with what would disprove it. It’s the best defence against fitting the data to a story later.

Step 4: Analyse signal trajectories over time

A single data point says very little. Plot each signal over 12, 24, and 36 months, and look at the direction and rate of change rather than the absolute level.

Use consistent time windows across signals so they can be compared. Be wary of the most recent months: filings and funding disclosures arrive with a lag, so the latest period can look artificially weak until the data catches up.

Step 5: Cross-reference signals

One indicator is fragile. Three pointing the same way is a pattern.

If formations are rising, early-stage funding is growing, and experienced hires are joining the sector, you’ve got a credible emergence story. If formations are rising but funding is flat and headcounts aren’t moving, you may be looking at a fashionable label rather than a real shift.

Step 6: Ground the analysis in specific companies

Every trend claim should be traceable to named companies and dated events. Identify the businesses driving each signal: the fastest-growing new entrants, the most active acquirers, the largest rounds, and the notable exits from the sector.

This is what turns a chart into an argument. It’s also what makes your analysis useful to clients and investors, who will want to know which companies to talk to next.

Step 7: Compare against historical sector shifts

Look for precedents. How did comparable sectors behave at the same stage? Useful reference points for the shape and speed of a trend include:

  • Fintech’s growth and consolidation
  • The rise and pullback of quick commerce
  • The cleantech funding cycles of the past two decades

Historical comparisons help you judge whether a signal is unusually strong, and what typically comes next.

Step 8: Publish, monitor and iterate

Treat a trend call as a hypothesis. Publish your analysis with clear assumptions, then keep watching the same signals. Set alerts on the companies and searches that underpin your argument, and revisit the call on a fixed cycle. Quarterly works for most fast-moving sectors.

If the signals continue, you’ve built credibility. If they reverse, you’ll be among the first to know, and you can update your view before anyone else does.

Worked examples of signal-to-trend analysis

Frameworks are easier to trust when you can see them in action. Here are three recent UK sector shifts, and what the company-level signals looked like as they unfolded. All figures come from the Beauhurst platform.

Example 1: a sector emergence pattern in London AI

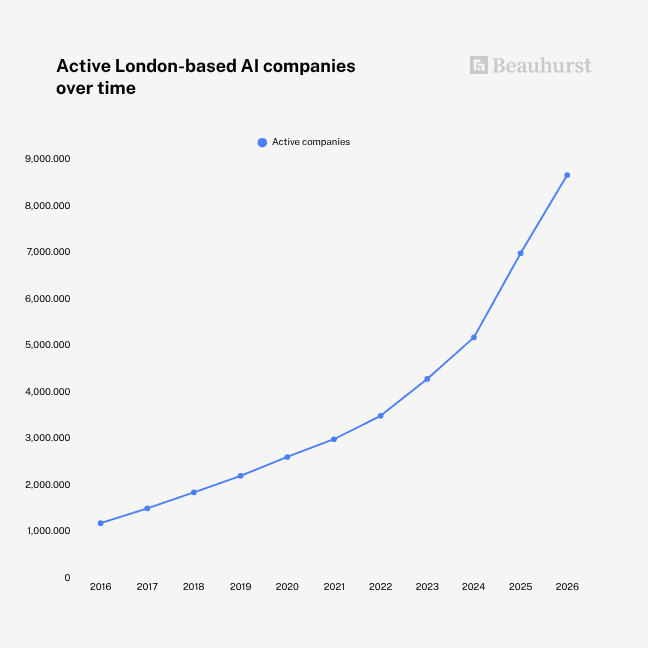
In 2016, Beauhurst tracked active AI 1.19k companies in London. By January 2026, that figure had reached 8.68k. 

Active London-based AI companies over time

The growth in company numbers was backed up by capital. London-based AI companies raised £5.50b across 755 funding rounds in 2025. That was the strongest year on record for both value and deal count.

The stage distribution shows a sector that is still emerging, even as its leaders mature. Seed-stage companies account for 58% of all London-based AI companies, and there was a record-breaking 1.08k foundations in 2025. Lots of new entrants plus large rounds for a few leaders is the classic profile of a sector that’s still being explored while early winners pull ahead.

The investor signal points the same way. Entrepreneurs First, a company builder that backs founders at the very earliest stage, was the most active investor by deal count, with 80 rounds.

Signals that converged: growth in company numbers, fundraising volume, stage distribution, and investor activity. For more on whether the momentum will hold, see Artificial Intelligence: Investment Bubble or Genuine Hypergrowth Market?

Explore how we found London-based AI companies using Beauhurst. 

Example 2: a funding boom-and-bust pattern in UK fintech, 2021–2023

In 2021, UK fintech looked unstoppable: companies raised £5.35b across 416 funding rounds. 2022 was another strong year, though it fell short of 2021’s peak.

The turn came quickly, however. Equity investment into UK fintech fell to just £1.85b across 356 funding rounds in 2023, and has stayed at roughly that level since.

Signals that converged: record investment, then a sharp fall in total value while the number of rounds dropped far less (about 14%, against a roughly 65% fall in value). Average round size shrank from about £12.9m to £5.2m. Investors were still writing cheques, but much smaller ones.

Example 3: a sector decline pattern in blockchain after the 2022 peak

UK blockchain companies raised £722m over 91 fundraisings in 2022, the sector’s all-time high, riding the post-pandemic crypto wave.

Since then, investment has stayed below that peak, with £542m raised in 2025. The company base has kept growing: Beauhurst now tracks 644 active UK blockchain companies, up from 82 at the end of 2015. But the capital behind it has cooled.

This is a useful reminder that ‘decline’ rarely means collapse. More often, it’s a shift from hype to a smaller, steadier market. Two signals are worth watching:

  • Funding falling while formations keep rising, which means more companies chasing less capital.
  • Changes in which sub-sectors attract the remaining money, such as compliance tooling, tokenisation, or payments infrastructure versus consumer crypto.

Signals that converged: falling deal value after a peak, while the company base kept growing. Sub-sector rotation could be the next signal to watch.

Common pitfalls when using company data for trend prediction

Company data is powerful, but it’s not self-interpreting. These are the mistakes that most often turn a sharp analysis into a misleading one.

Confusing noise with signal

Early-stage sectors are volatile. A single £100m round can double a niche’s annual investment total, and a handful of incorporations can look like a surge from a low base.

Before calling a trend, check whether it holds across multiple quarters and isn’t driven by one or two outliers. Medians and deal counts are often more telling than totals.

Relying on one indicator

Funding alone can mislead, because capital follows hype as readily as substance. Formations alone can mislead too, since incorporating a company costs very little. Always cross-reference at least three signals before drawing a conclusion.

Survivorship bias

Sector reports built only on the companies still trading miss the churn. If you only study today’s successful players, every sector looks healthier than it is.

Include dissolved and dormant companies in your analysis. That shows you the true rate of attrition, and what failure looks like in this sector.

Retrospective narrative fitting

It’s tempting to start with the conclusion and go looking for supporting data. Company data is rich enough that you’ll usually find some.

Write down your hypothesis and the evidence that would disprove it before you look. Then report the signals that don’t fit as well as the ones that do.

Confusing sector migration with sector emergence

When companies tagged with a new buzzword multiply, it’s not always because new businesses are being created. Often, existing companies are relabelling themselves to ride a wave.

Check incorporation dates. If most of the ‘new’ sector’s companies are 10 years old, you’re seeing migration rather than emergence. Both matter, but they mean different things.

Ignoring geographic effects

A sector booming nationally may be flat in the region you care about, and vice versa. London often dominates UK totals, masking very different dynamics elsewhere. If your client, portfolio, or policy question is regional, cut the data regionally.

Under-weighting private company signals

Public company data is easier to access through earnings calls, annual reports, and analyst coverage. But the vast majority of UK companies are private, and that’s where sector shifts tend to start. An analysis built mainly on listed companies will be late to almost every trend that matters.

How Beauhurst helps predict industry trends

Bottom-up trend analysis is only as good as the data underneath it. Stitching together Companies House filings, funding announcements, news, hiring data, and patent records by hand is slow, inconsistent, and almost impossible to repeat every quarter. Beauhurst brings it all into one place.

Every UK private company in one dataset

Beauhurst provides complete coverage of every private company in the UK, plus Germany and Ireland. Your analysis starts from the whole population, not a sample or a survey panel, so you see the quiet incorporations and dissolutions as well as the headline-grabbers.

And with True Companies, multiple legal entities belonging to the same business are consolidated into a single profile. Group structures don’t inflate company counts or double-count financials.

Industry classification and buzzwords beyond SIC codes

Our industry classification covers millions of UK companies, combining machine learning with the judgement of our in-house data team.

Buzzwords are assigned by our researchers for high-growth companies, and by machine learning across the wider population. They capture emerging themes that SIC codes can’t see, such as generative AI, quantum, and defencetech. 

Time-series data on every signal that matters

Formations, dissolutions, fundraisings, acquisitions, headcount, and ownership changes are all dated events in Beauhurst. Our UK fundraising data includes rounds that were never announced to the media (around 60% of all equity fundraisings), so your investment trend lines reflect what actually happened rather than only what was press-released.

Every signal on one company profile

Every company profile brings these signals together side by side:

  • Financials and corporate structure
  • Shareholders
  • Grants and patents
  • Accelerator attendance and high-growth list appearances
  • Risk signals such as county court judgments (CCJs)

That makes cross-referencing (Step 5 of the framework) a matter of applying a filter.

Sector, sub-sector and buzzword filters

Combine industries, buzzwords, description keywords, location, and company stage to define your sector scope precisely, then save the search. Re-run it every quarter and you’ve got a consistent, repeatable baseline to track change against.

Cross-sector visibility for spotting migration

Because companies can carry multiple industry tags and buzzwords, you can see when established businesses start moving into new territory. You can also separate new entrants from incumbents relabelling themselves.

BeauhurstInsights: data-led sector reports and bespoke research

If you’d rather have the analysis done for you, BeauhurstInsights, our research service run by the Research & Consultancy team, uses Beauhurst data to produce bespoke research, thought leadership, and sector analysis.

Some teams want to run the analysis themselves, including strategy consultants, corporate development teams, and investors. 

BeauhurstAdvise gives consultants and advisers the same data to work with directly, while BeauhurstInvest does the same for investors and corporate development teams.

Predicting industry trends using data

Industry trends don’t start in annual reports. They start with a cluster of incorporations, a run of seed rounds, a repeat acquirer, or a quiet rise in headcount. These events are visible in company data months or years before they reach the aggregate statistics.

Analysts who consistently use data can see the turn coming, and show the companies behind it.

Want to build sector analysis on bottom-up company data? Speak to our BeauhurstInsights team about a bespoke project, or book a demo to explore the data yourself.


By the time it’s in the press, the mandate’s already goneDiscover BeauhurstAdvise

FAQ

Discover our data

Get access to unrivalled data on all the companies you need to know about, so you can approach the right leads, at the right time.

Book a demo today to see all of the key features of the Beauhurst platform, as well as the depth and breadth of data available.

An associate will work with you to build a sophisticated search, returning a dynamic list of organisations that match your ideal customer profile.